Github Gitmos
March 2021 ––More than a platform and more than a community, GitHub is a collective consciousness of code — a living archive of innovation continuously shaped, revised, and expanded by developers around the world. Millions of contributions, commits, pull requests, and collaborations converge into an evolving ecosystem of human thought translated into software. To us, GitHub represented something far beyond engineering infrastructure. It felt like a living record of collective intelligence unfolding in real time.
We were tasked with building an immersive series of real-time data visualizations using GitHub’s vast repository of live activity, transforming invisible systems into a cinematic and generative visual experience for the company’s headquarters lobby. The installation would serve as both a functional information system and an emotional entry point into GitHub’s culture, expressing the energy, complexity, and scale of the platform through motion, light, and living data.
Pairing imagination with real information from real people, we wanted to tell a human story about how data lives, breathes, propagates, and evolves from individuals into larger systems. We became fascinated with the idea that beneath every repository exists an invisible network of people connected through creativity, collaboration, and problem solving. The project became an opportunity to reveal the hidden pulse of that network and ultimately bring to life the source code of the science fiction future to come.
The Lobby
–– 01The Experience
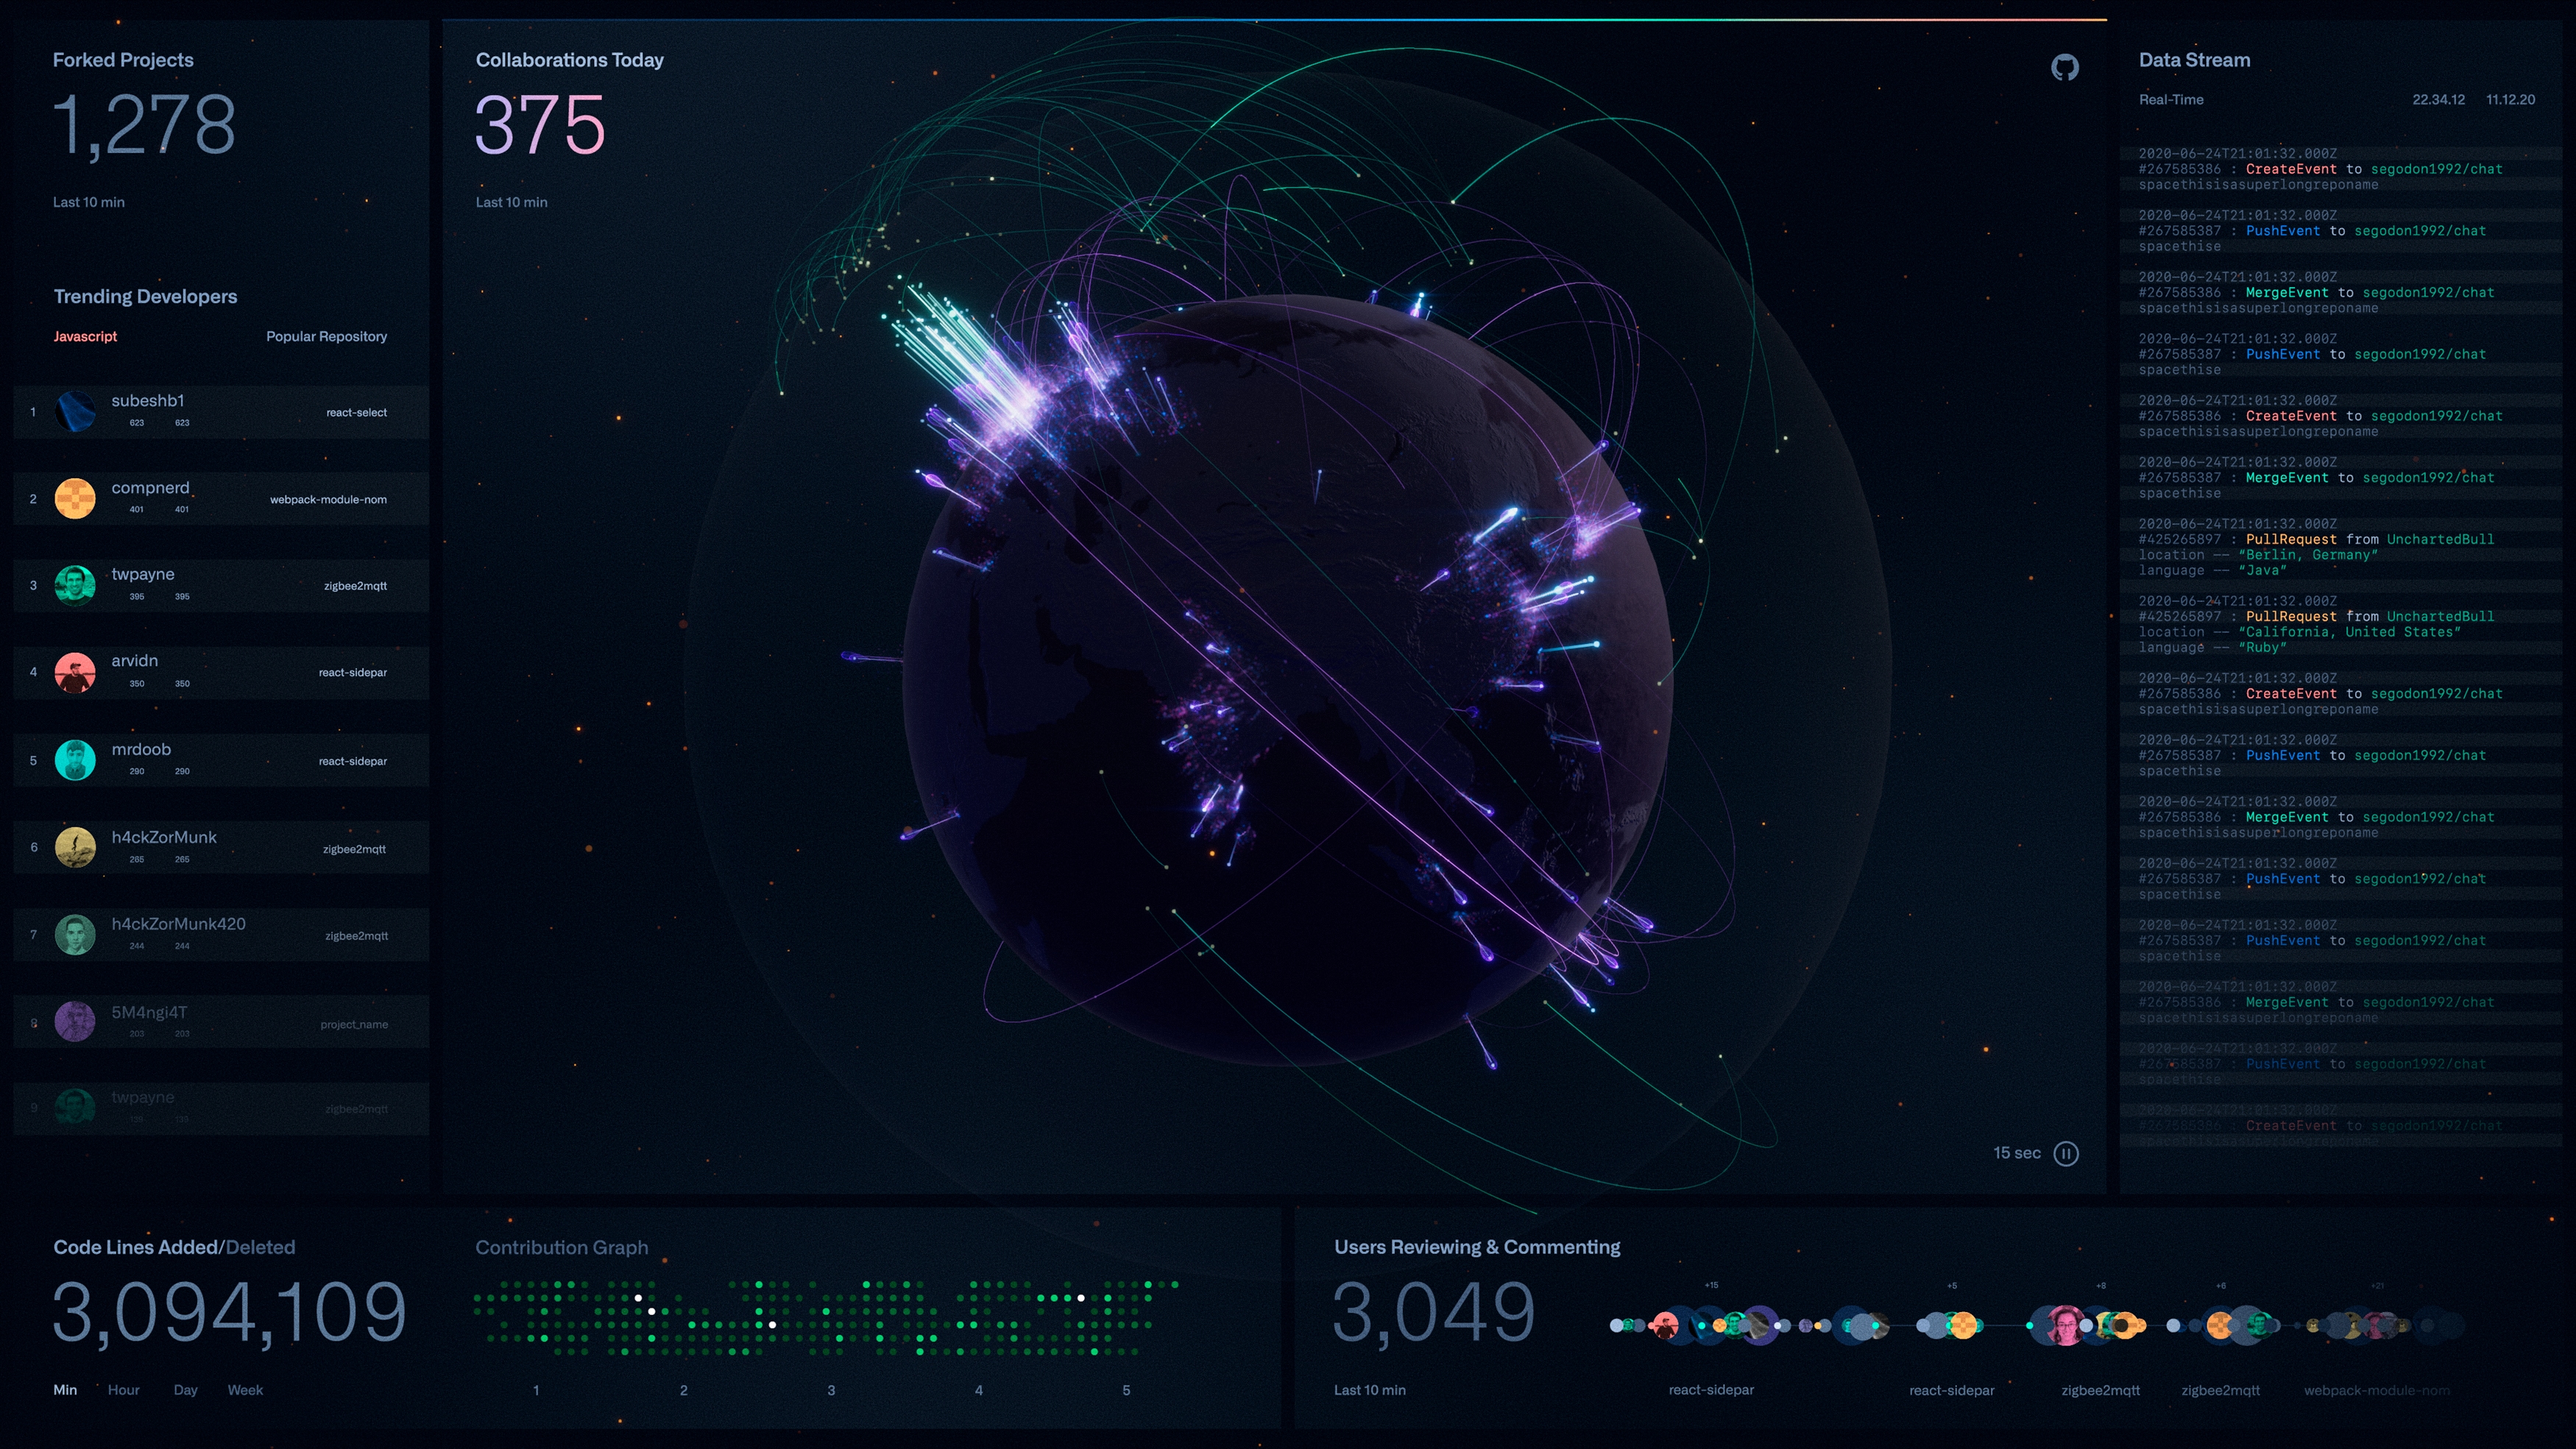
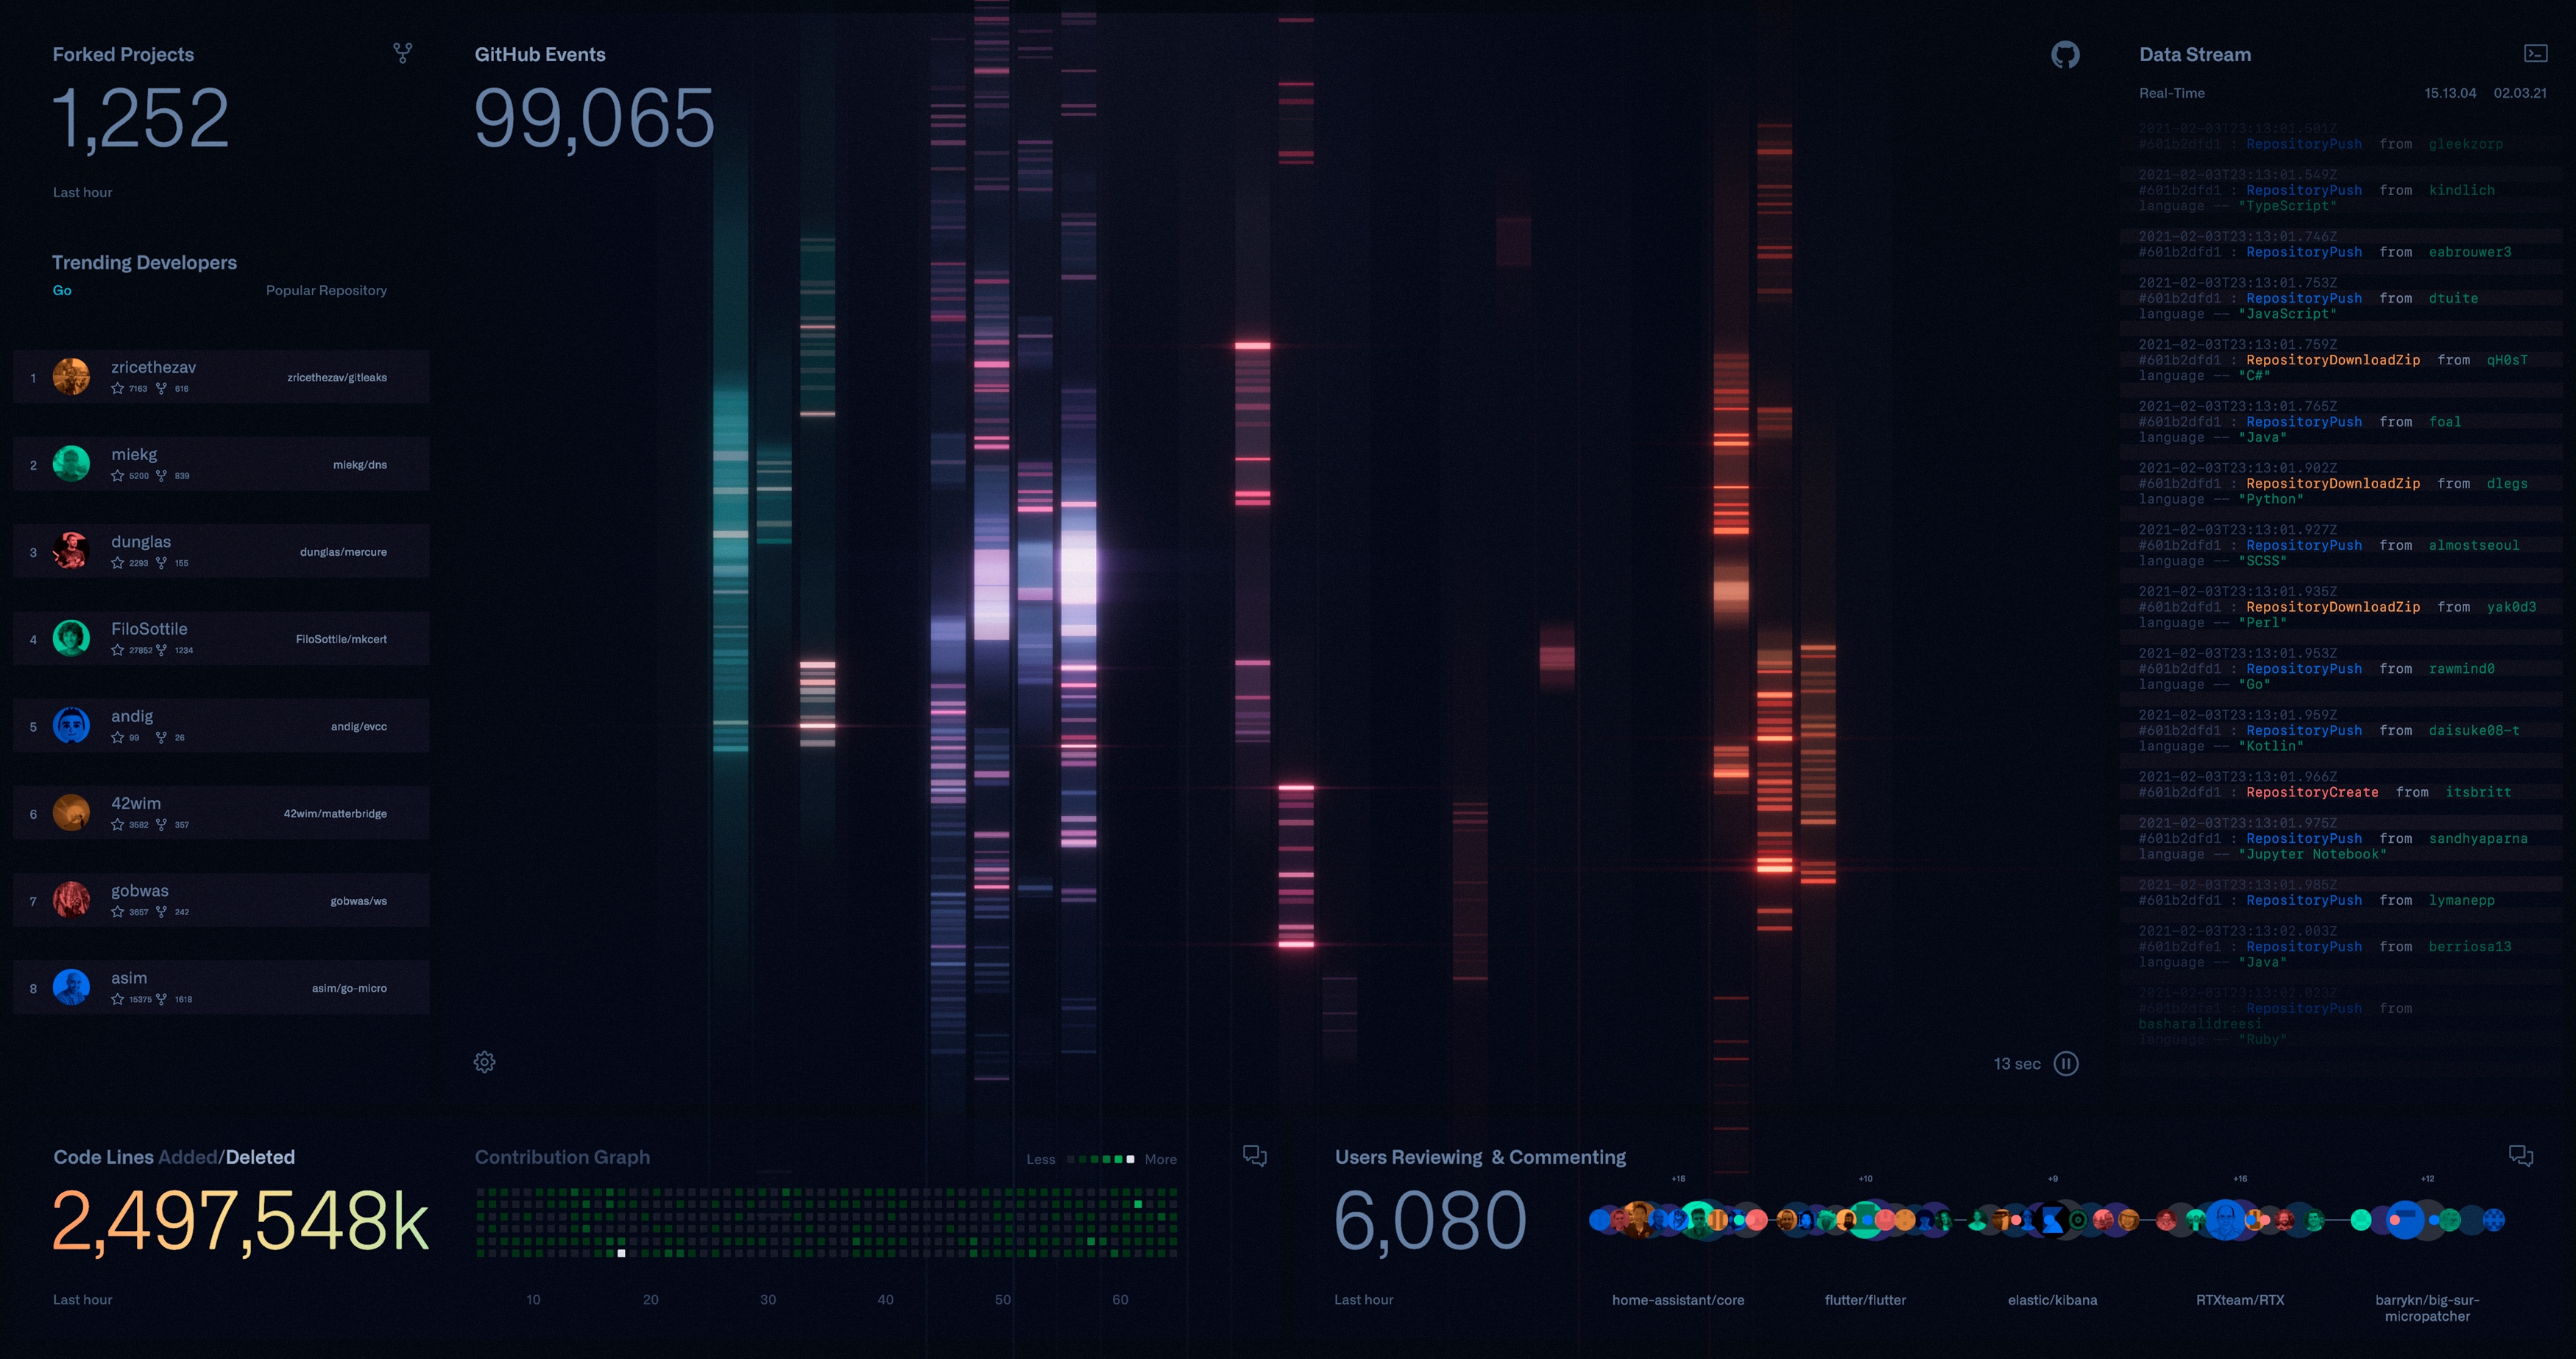
–– 02When visitors entered GitHub’s lobby, they were met with an evolving expression of the company’s code ecosystem unfolding across an epic architectural screen. Massive streams of information pulsed, modulated, synchronized, and transformed together as one unified visual organism, creating the sensation of stepping inside a living computational environment. The atmosphere felt somewhere between an advanced mission control system and the cinematic language of the Matrix — immersive, intelligent, and constantly alive.
The installation operated as a time-based generative system, meaning no two moments were ever the same. Presentation layouts continuously shifted and reorganized themselves while live GitHub activity updated in real time across multiple layers of visualization. Data streams expanded, contracted, clustered, and dispersed according to a metronome measuring a constant global flow of activity. Different interface states emerged and dissolved throughout the day, allowing the system to feel endlessly variable and perpetually in motion.
Rather than behaving like a static display or informational dashboard, the experience was designed to feel sentient — a responsive digital organism continuously processing and expressing the collective rhythm of software development happening around the world. Every second introduced new interactions, new movements, and new visual relationships generated directly from live contributions flowing through GitHub’s ecosystem.
–– 02


The Design
–– 03Our goal was not simply to visualize data on a screen, but to develop a complete interface design system in which the data itself could live. We wanted to create a framework that merged cinematic graphic design with the beauty and complexity of real-time information systems. The challenge became designing a visual language capable of housing enormous quantities of live data while still feeling elegant, immersive, and emotionally resonant.
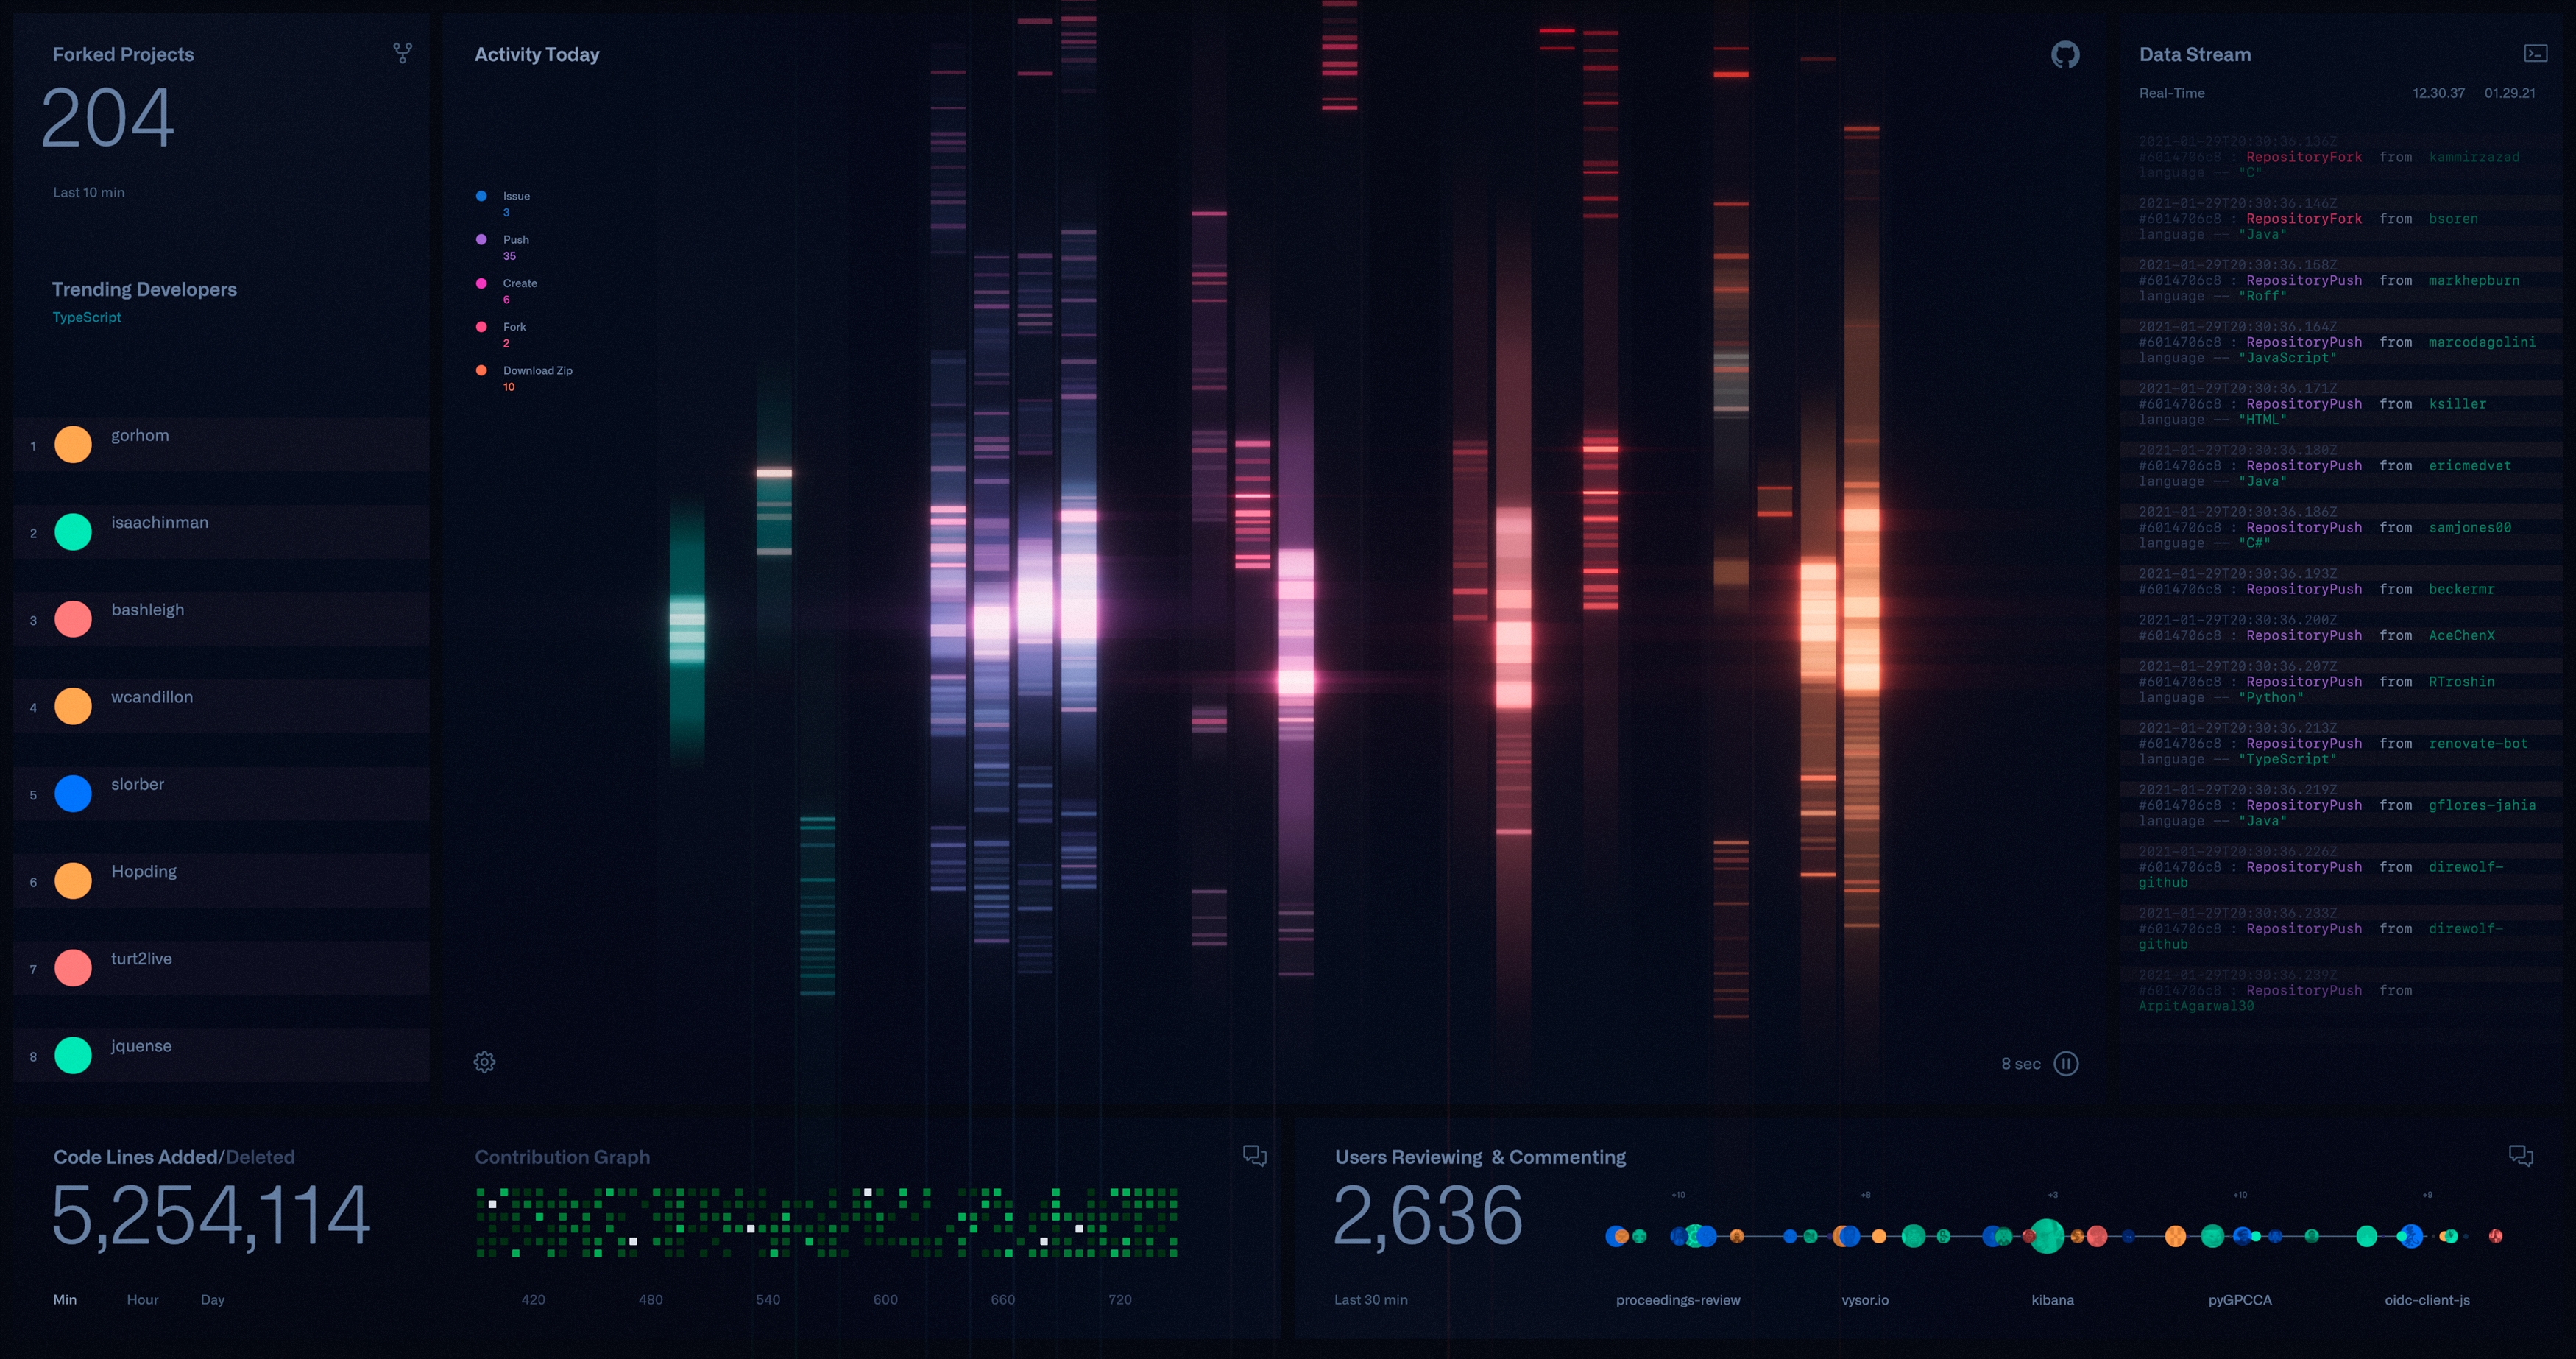
The system was constructed as a multilayered visual architecture combining grid-based graphical design with dimensional 3D visualization. Information could peel backward into depth, transition between different states, and reorganize itself dynamically depending on the live parameters being displayed. Layers moved independently yet remained interconnected, allowing the interface to feel simultaneously analytical and atmospheric.
Every visual component was designed to contribute to the sensation that the system itself was alive. Information existed inside dynamic graphic containers that constantly processed, updated, scanned, and evolved like a sentient computational entity absorbing the pulse of global collaboration. Typography, geometry, motion systems, particle behaviors, and spatial transitions all worked together to create an interface language that felt both cinematic and functional.
Nothing is more exciting than building design systems. For over fifteen years, GMUNK has developed speculative interface systems and futuristic visualization languages for feature films, often centered around fictional representations of infinite data systems. This project became an opportunity to bring that cinematic vocabulary into reality using living information streams instead of imagined ones. The result blurred the boundary between science fiction interface design and real-world computational visualization.
–– 03
The Data
–– 04To us, the data had a soul.
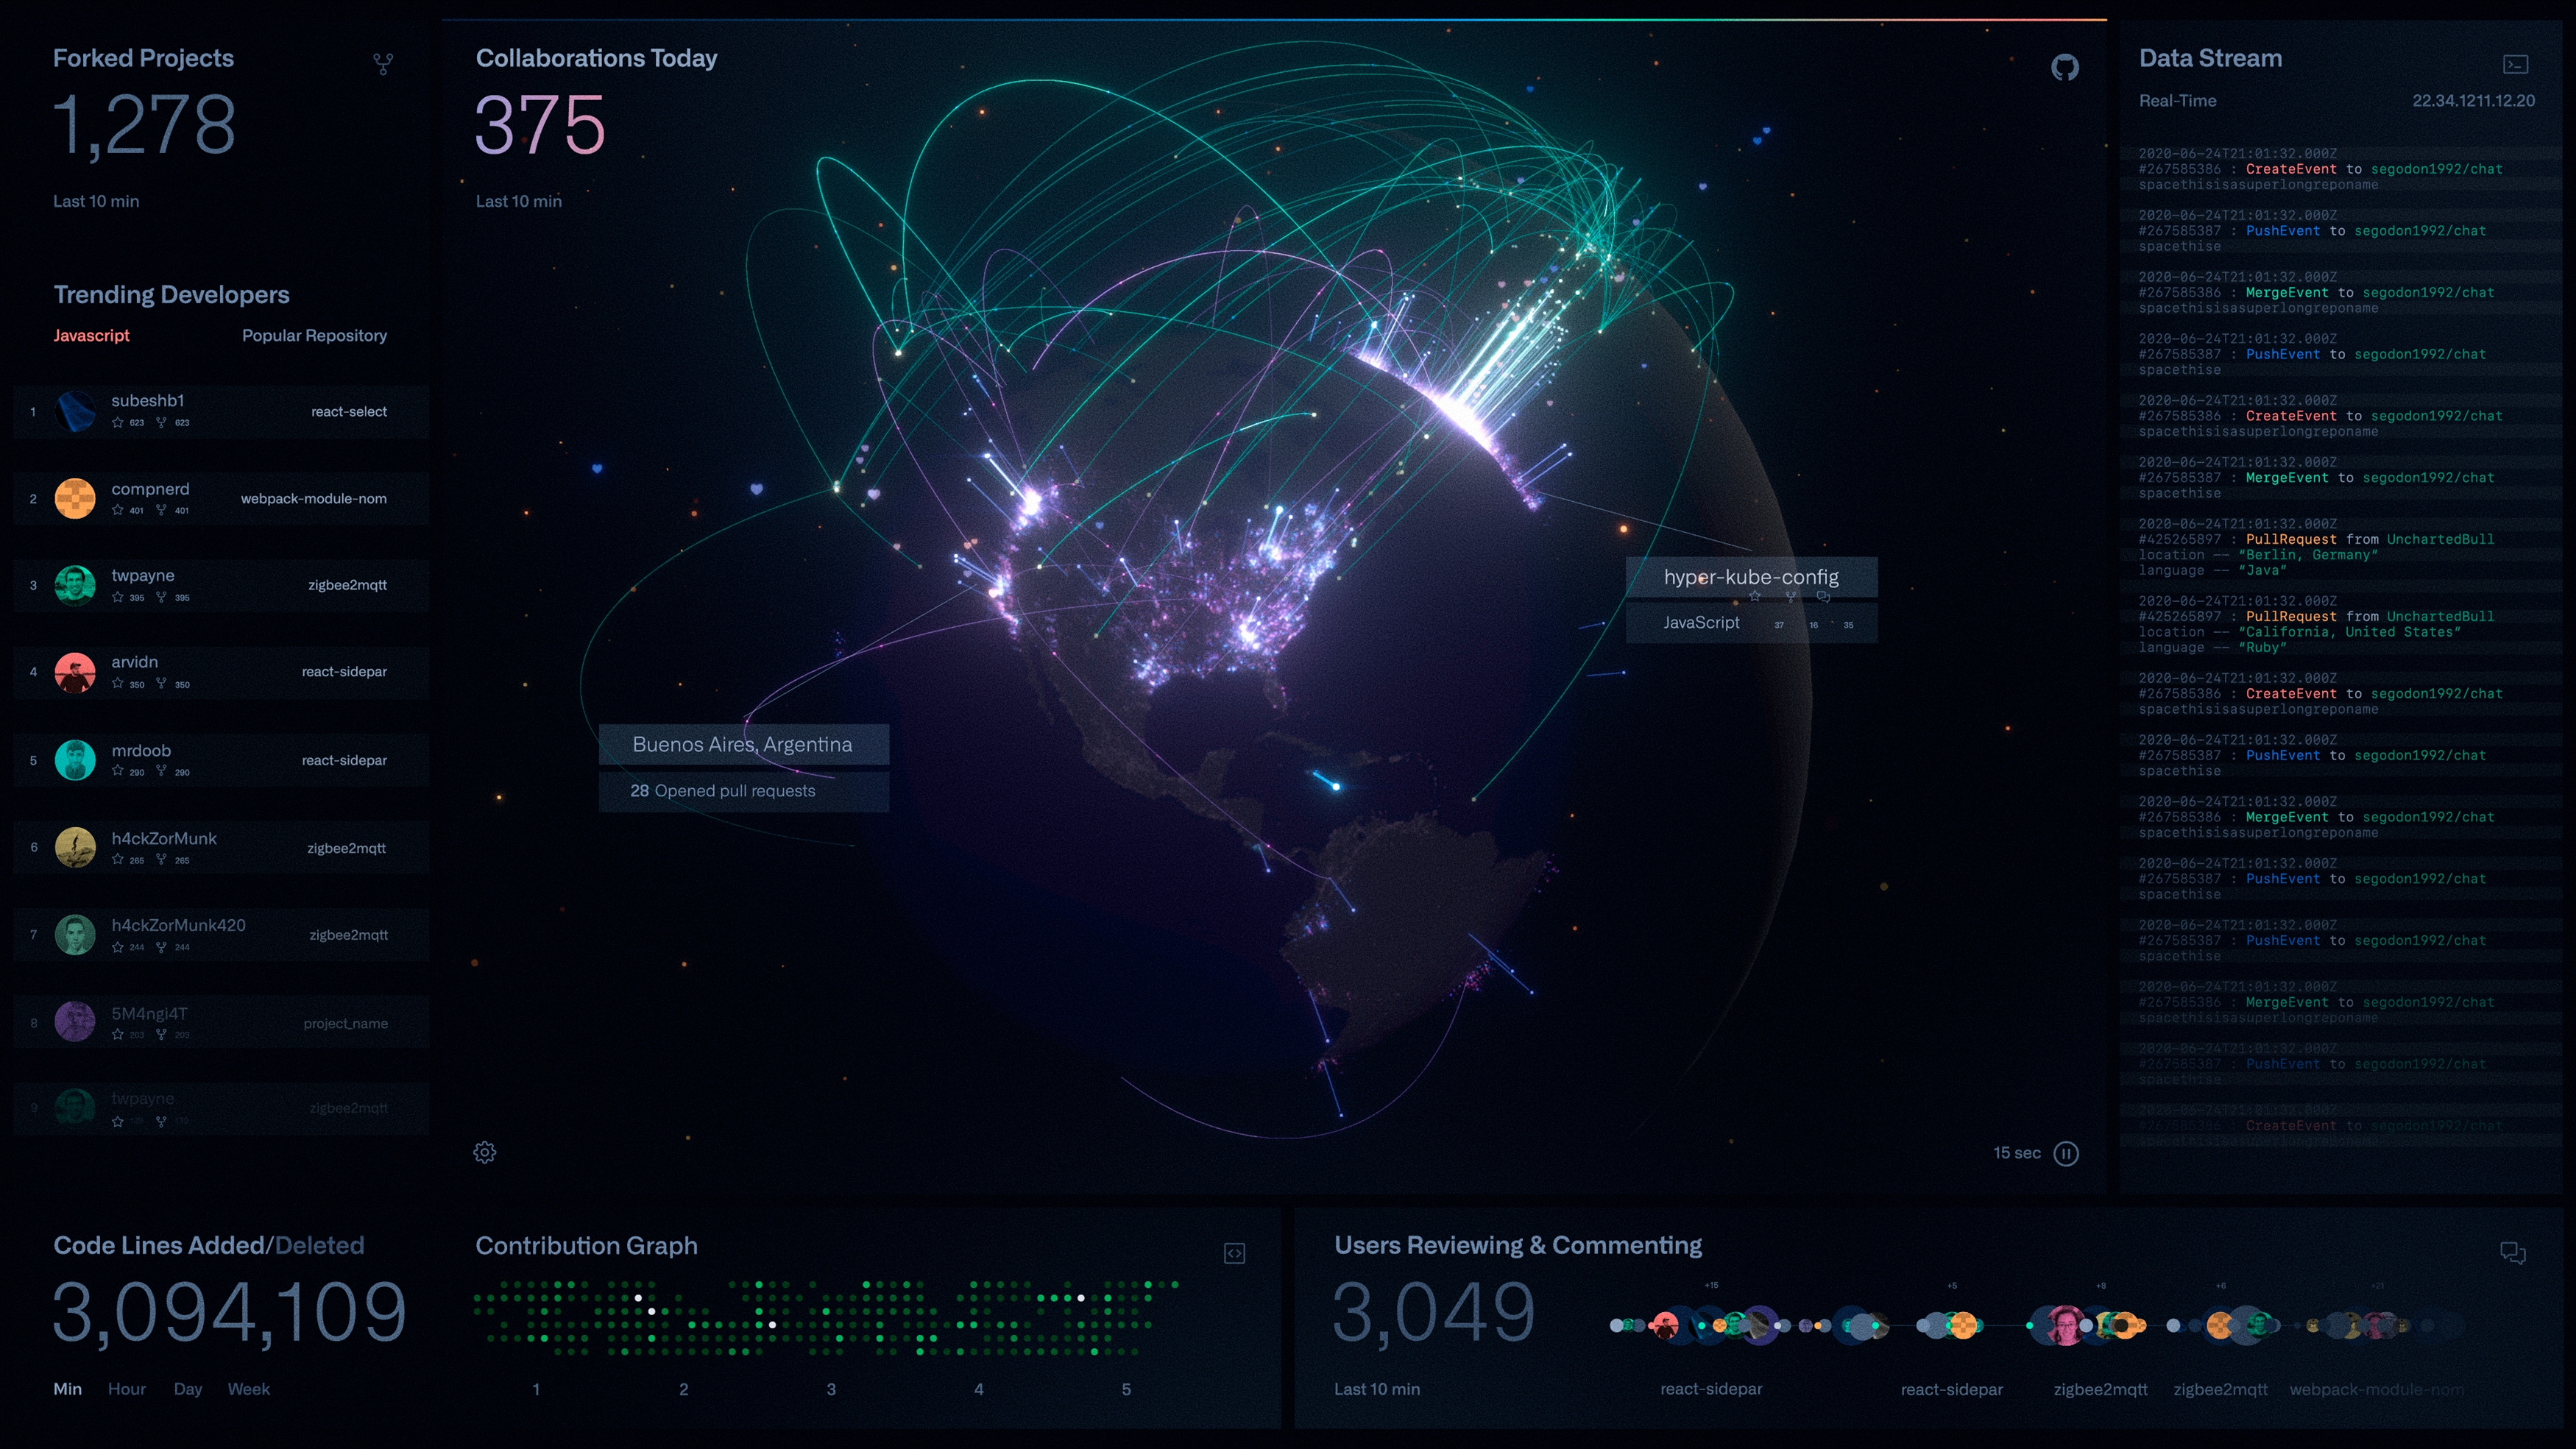
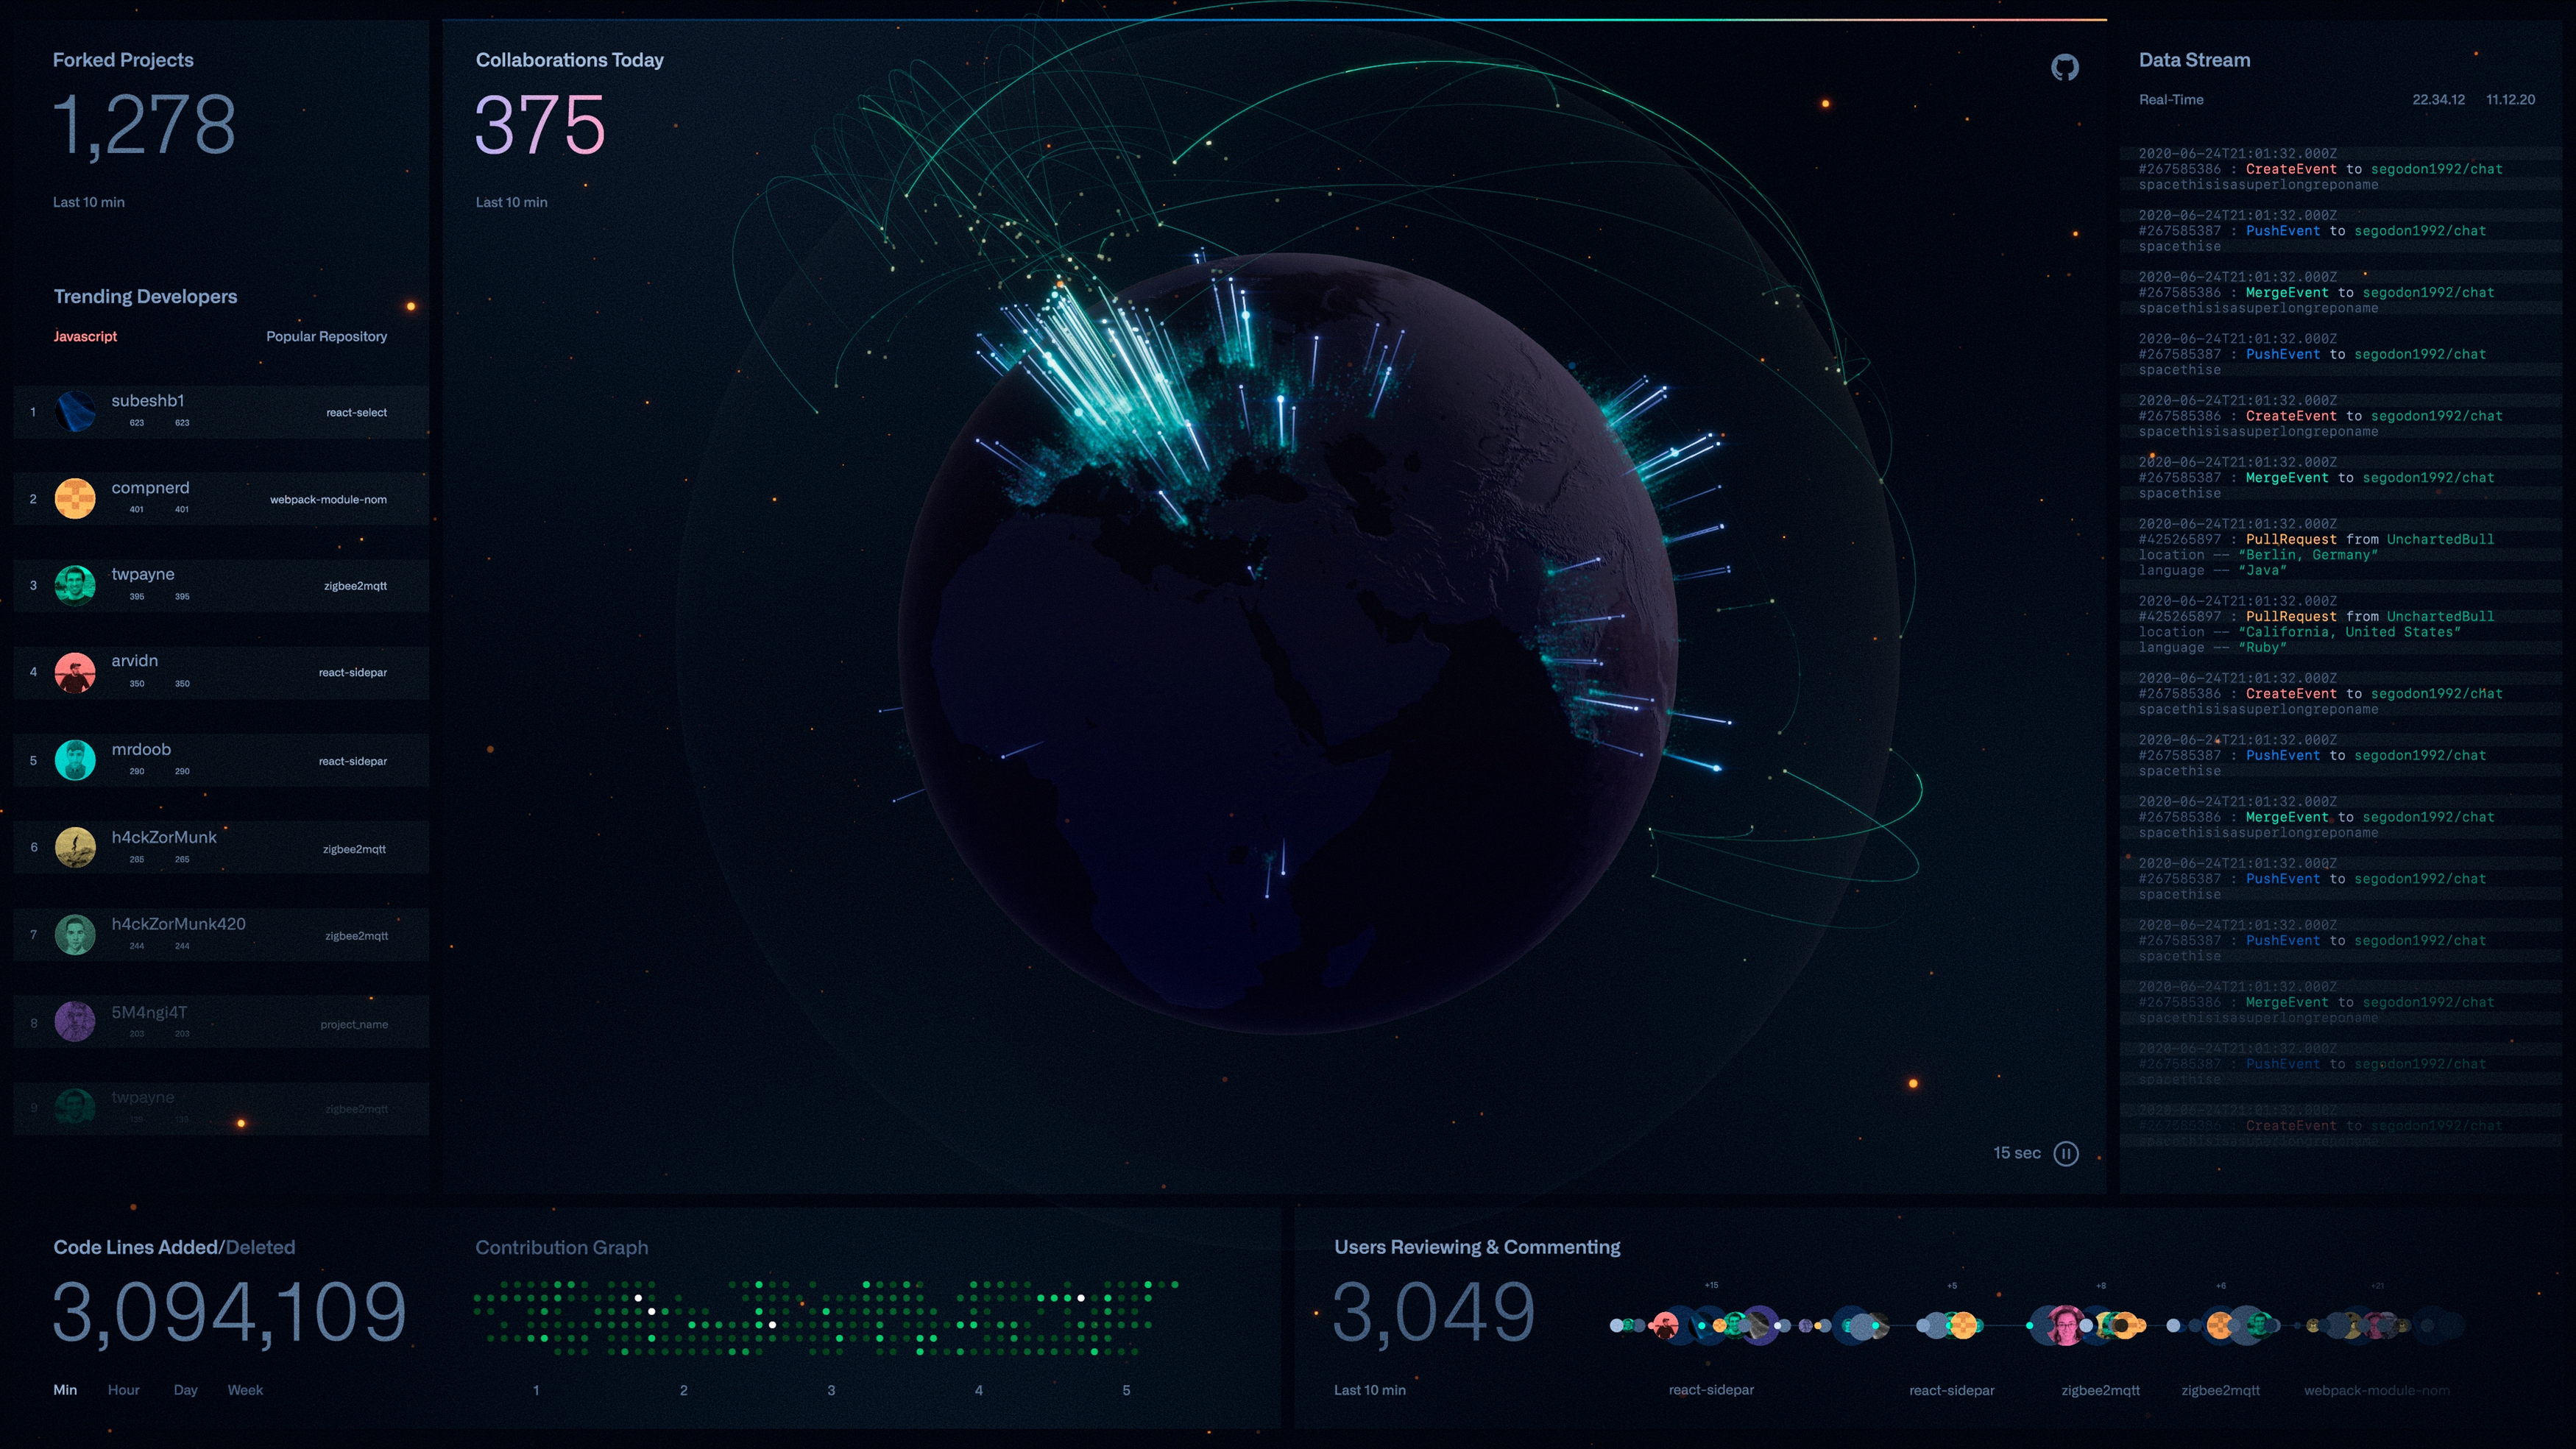
Every visualization represented a deeper network of contributions, collaborations, and ideas propagating outward across GitHub’s ecosystem. Beneath every line of code existed layers of human connection — millions of people building, modifying, refining, and evolving systems together in real time. We became interested not only in the functionality of the data, but in the emotional and philosophical implications of visualizing collective intelligence at planetary scale.
The installation transformed abstract information into something living and experiential. Data streams became behaviors. Contributions became motion. Repositories became evolving structures of light and geometry. The system revealed how individual actions ripple outward into larger collaborative frameworks, continuously reshaping the technological landscape through countless interconnected decisions happening every second around the world.
What made the project particularly meaningful was that the data was real. Unlike fictional interface systems designed for cinema, these visualizations were powered by actual human activity unfolding live across GitHub’s platform. That authenticity created a personal connection that pushed the work toward new levels of complexity, detail, and narrative depth. Every movement on screen represented real people actively shaping the future through software.
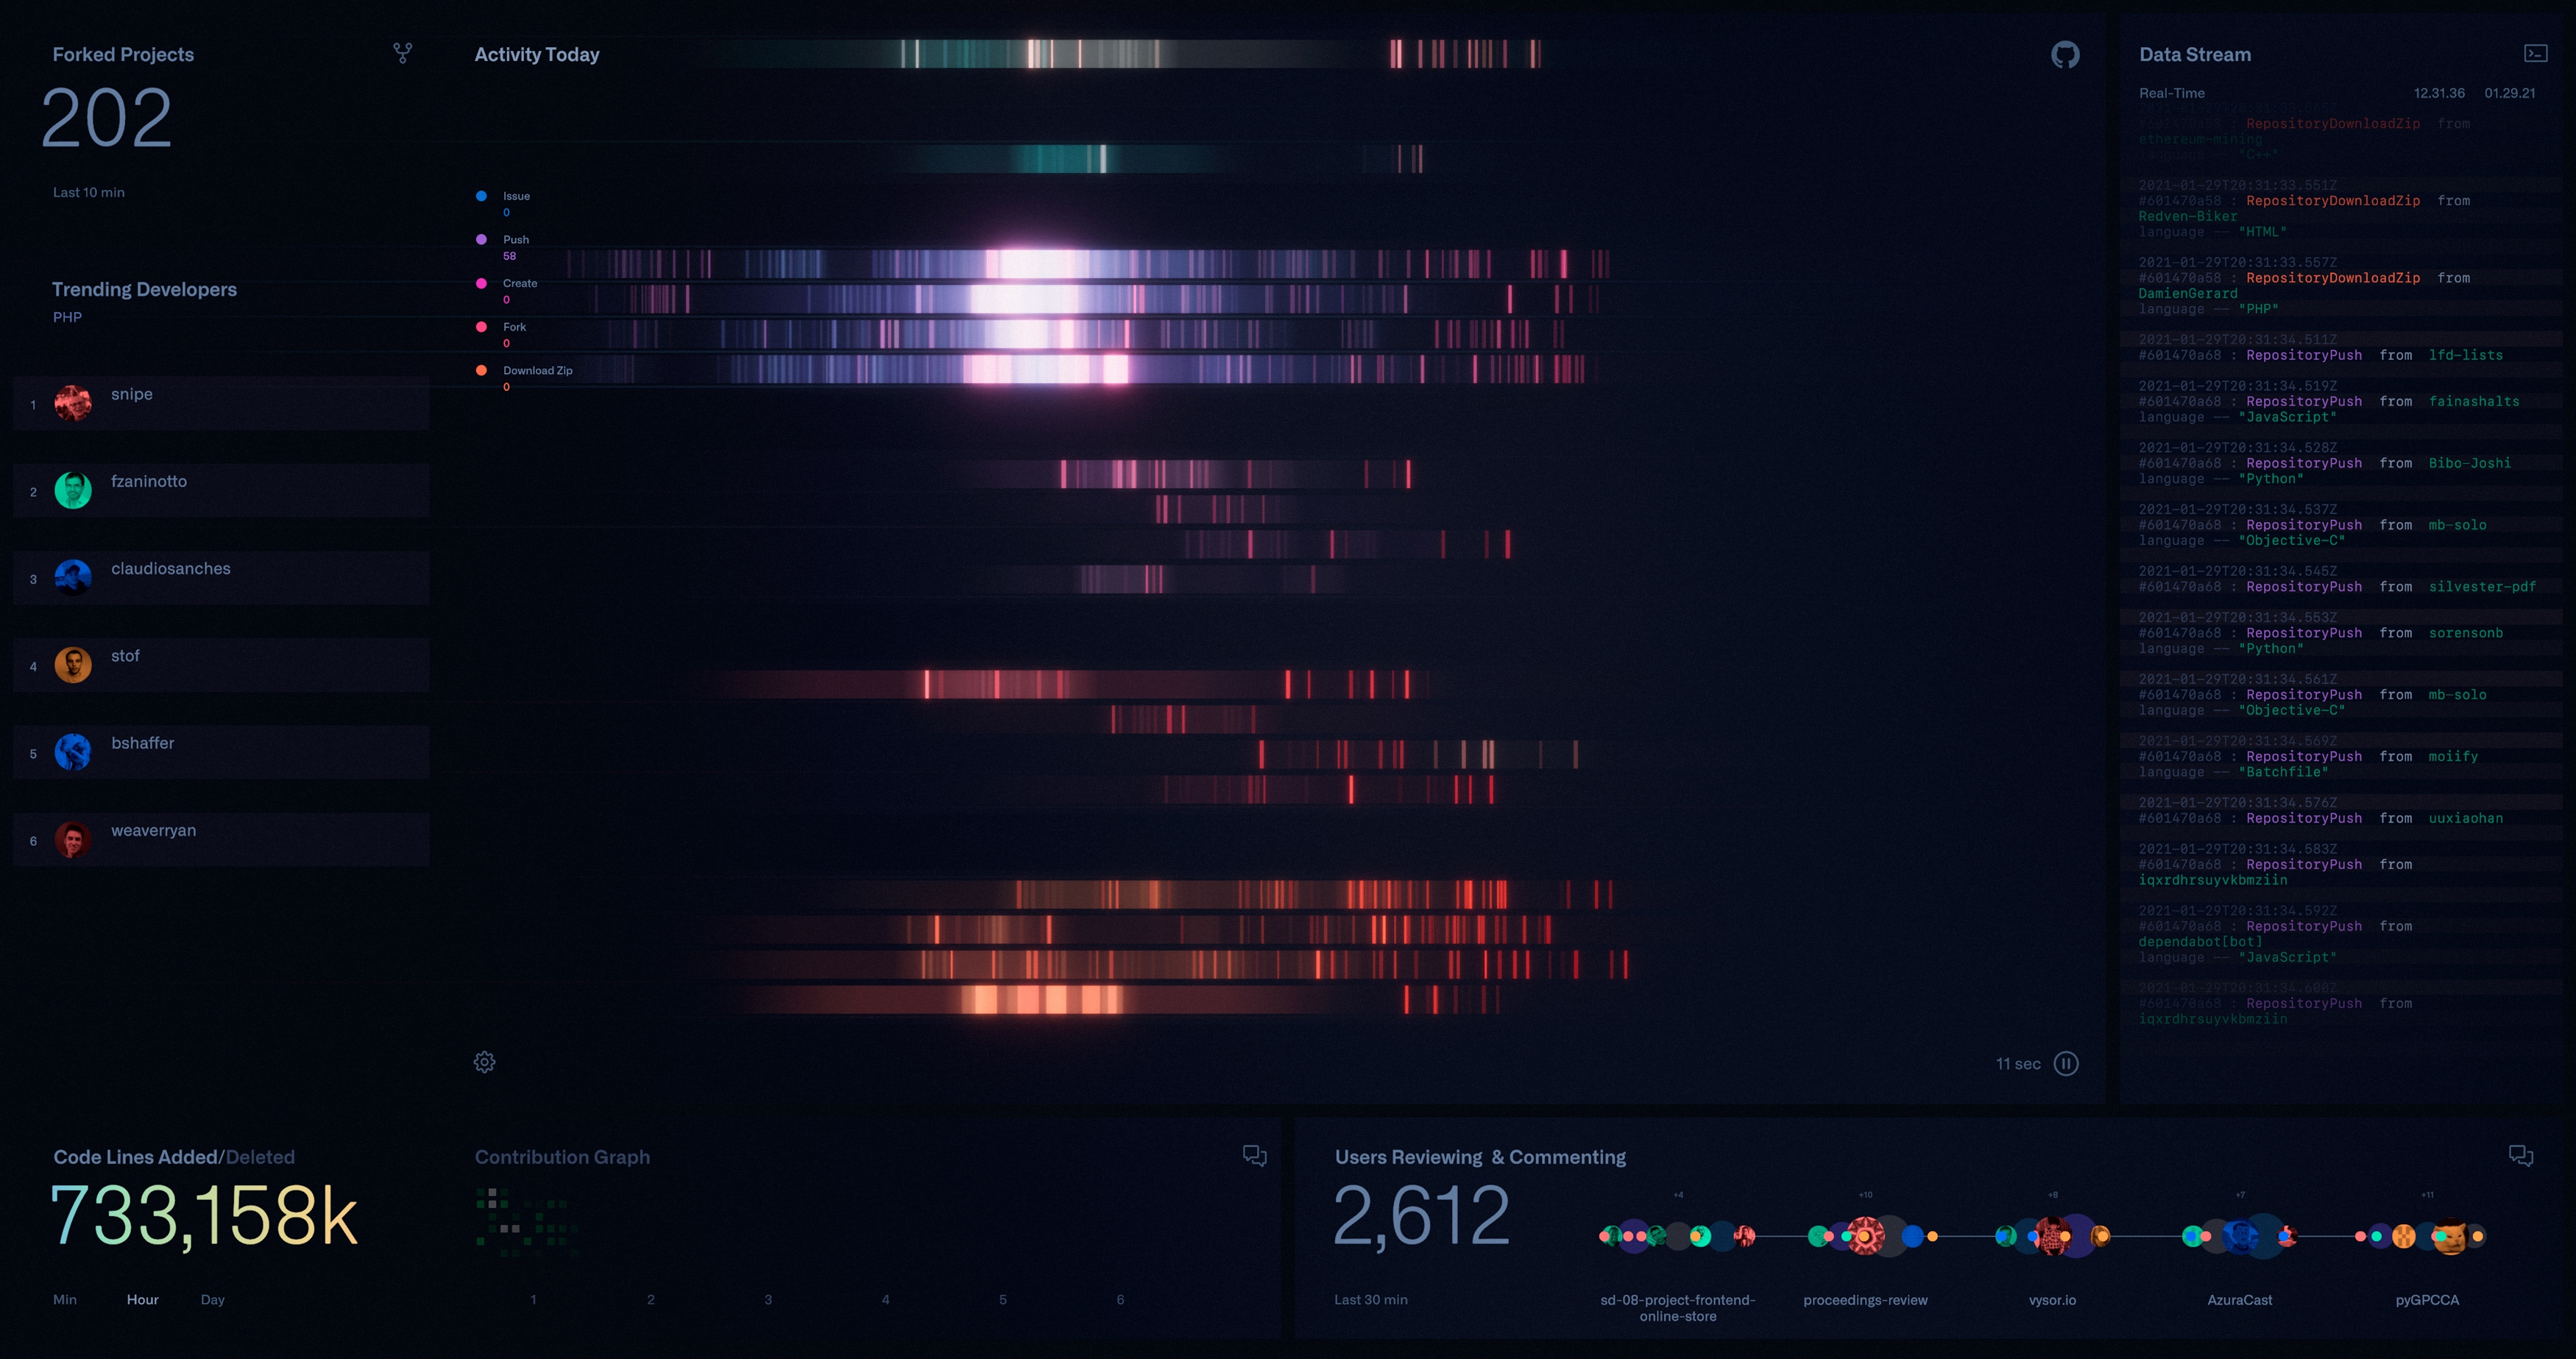
The result became more than a dashboard or data visualization platform. It became a living visual organism built from the collective activity of developers worldwide — an immersive expression of GitHub’s collective consciousness continuously evolving in real time.
Every visualization represented a deeper network of contributions, collaborations, and ideas propagating outward across GitHub’s ecosystem. Beneath every line of code existed layers of human connection — millions of people building, modifying, refining, and evolving systems together in real time. We became interested not only in the functionality of the data, but in the emotional and philosophical implications of visualizing collective intelligence at planetary scale.
The installation transformed abstract information into something living and experiential. Data streams became behaviors. Contributions became motion. Repositories became evolving structures of light and geometry. The system revealed how individual actions ripple outward into larger collaborative frameworks, continuously reshaping the technological landscape through countless interconnected decisions happening every second around the world.
What made the project particularly meaningful was that the data was real. Unlike fictional interface systems designed for cinema, these visualizations were powered by actual human activity unfolding live across GitHub’s platform. That authenticity created a personal connection that pushed the work toward new levels of complexity, detail, and narrative depth. Every movement on screen represented real people actively shaping the future through software.
The result became more than a dashboard or data visualization platform. It became a living visual organism built from the collective activity of developers worldwide — an immersive expression of GitHub’s collective consciousness continuously evolving in real time.
–– 04


Credit List
Production
Director: GMUNK
Production Company: Tool
Managing Partner: Dustin Callif
Executive Producer: Adam Baskin
Producer: Matt Walsh
Lead UI Designer: Toros Kose
Lead UX Designer: Jake Sargeant
Lead Unity Artist: Stephen Mangiat
Composer: Keith Ruggiero
Production
Director: GMUNK
Production Company: Tool
Managing Partner: Dustin Callif
Executive Producer: Adam Baskin
Producer: Matt Walsh
Lead UI Designer: Toros Kose
Lead UX Designer: Jake Sargeant
Lead Unity Artist: Stephen Mangiat
Composer: Keith Ruggiero